Hosted error tracking

4,000 crashes.
One issue.

BugCatch catches unhandled exceptions across your web, Node, Java, and React Native apps, fingerprints each one, and collapses the duplicates. You get a single issue with the stack trace and the clicks that led to it - not four thousand identical emails.

Free to start · No credit card · Your first error in under five minutes

  • SDKs
  • JavaScript / TypeScript
  • Node.js
  • React Native & Expo
  • Java 21+
  • Zero runtime dependencies. ~15 KB.

What it is

An error tracker for teams who want the signal without the enterprise contract.

Install the SDK, paste a DSN, ship. From then on every uncaught exception and rejected promise arrives with a resolved stack trace, the breadcrumb trail that preceded it, the user it happened to, and the release it shipped in.

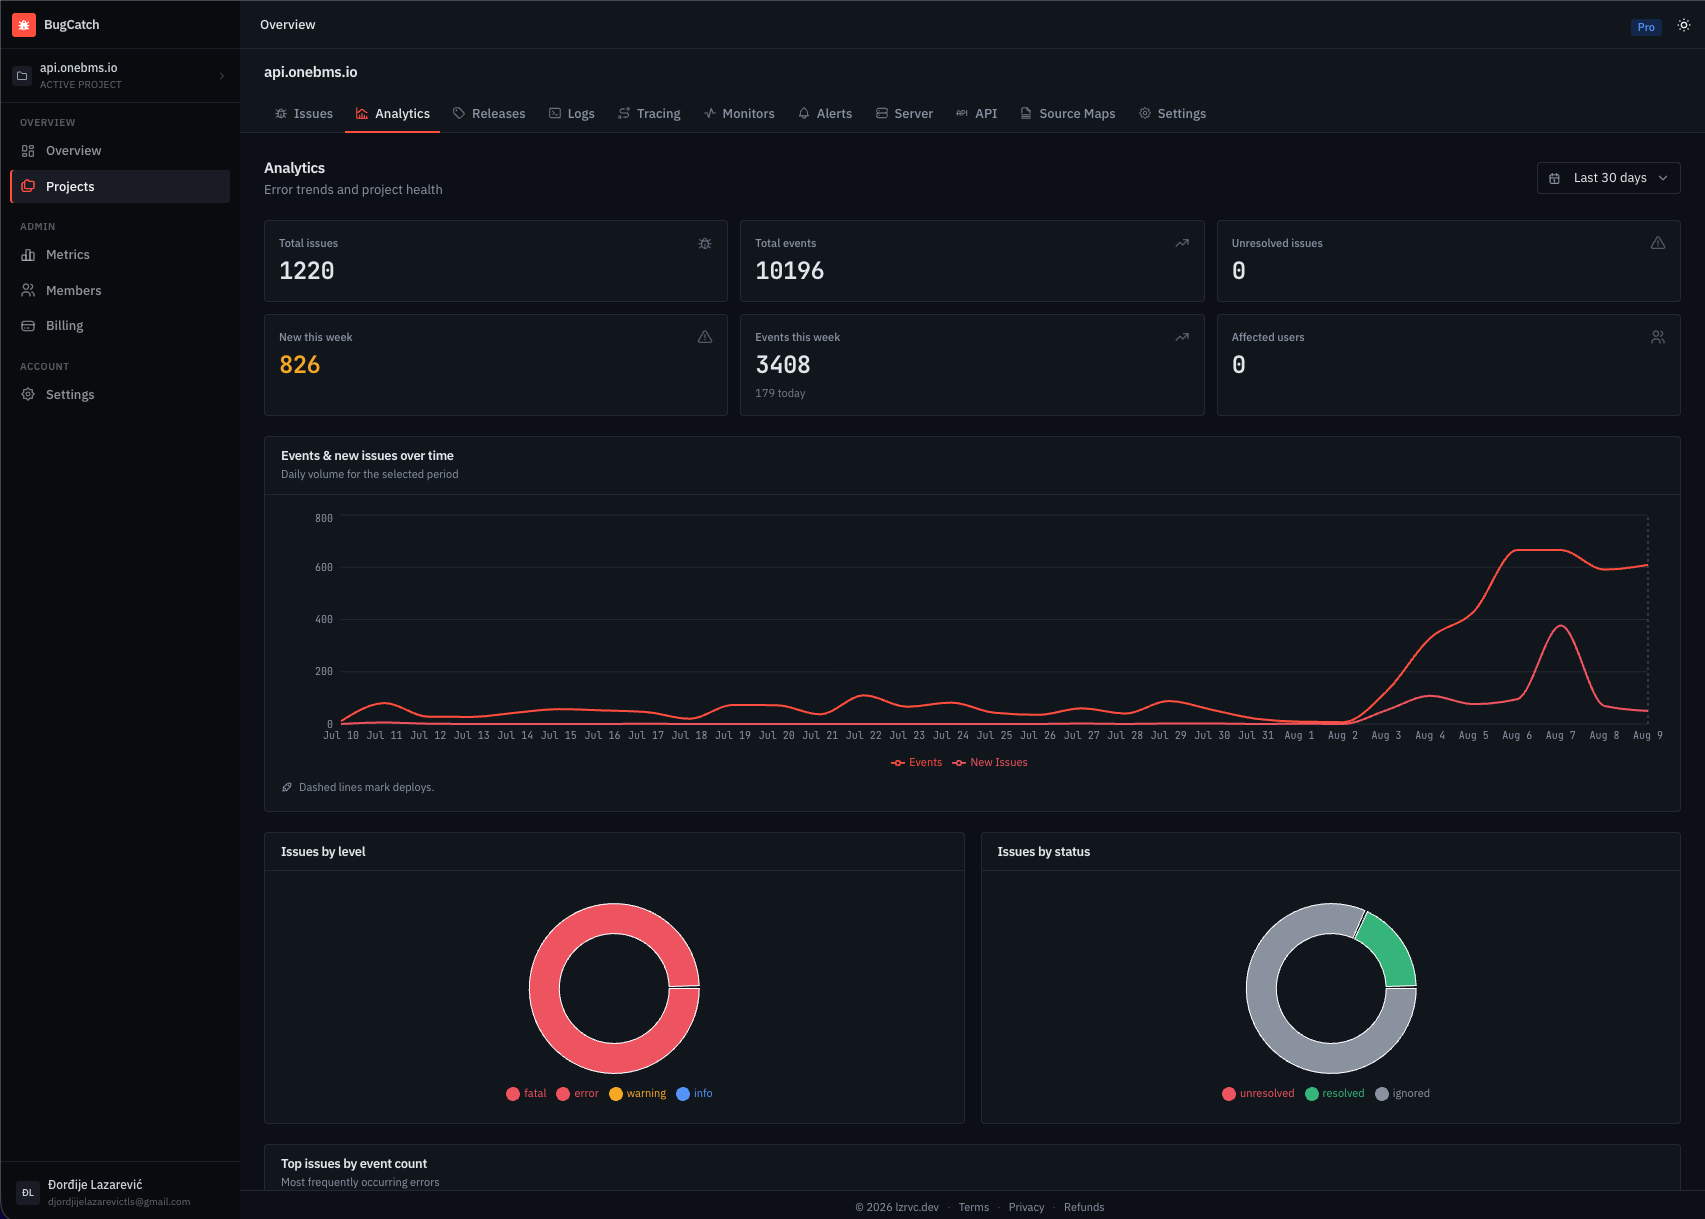
BugCatch also watches the things that break without throwing: endpoints that got slow, queries that got slower, heap that keeps climbing, and URLs that stopped responding.

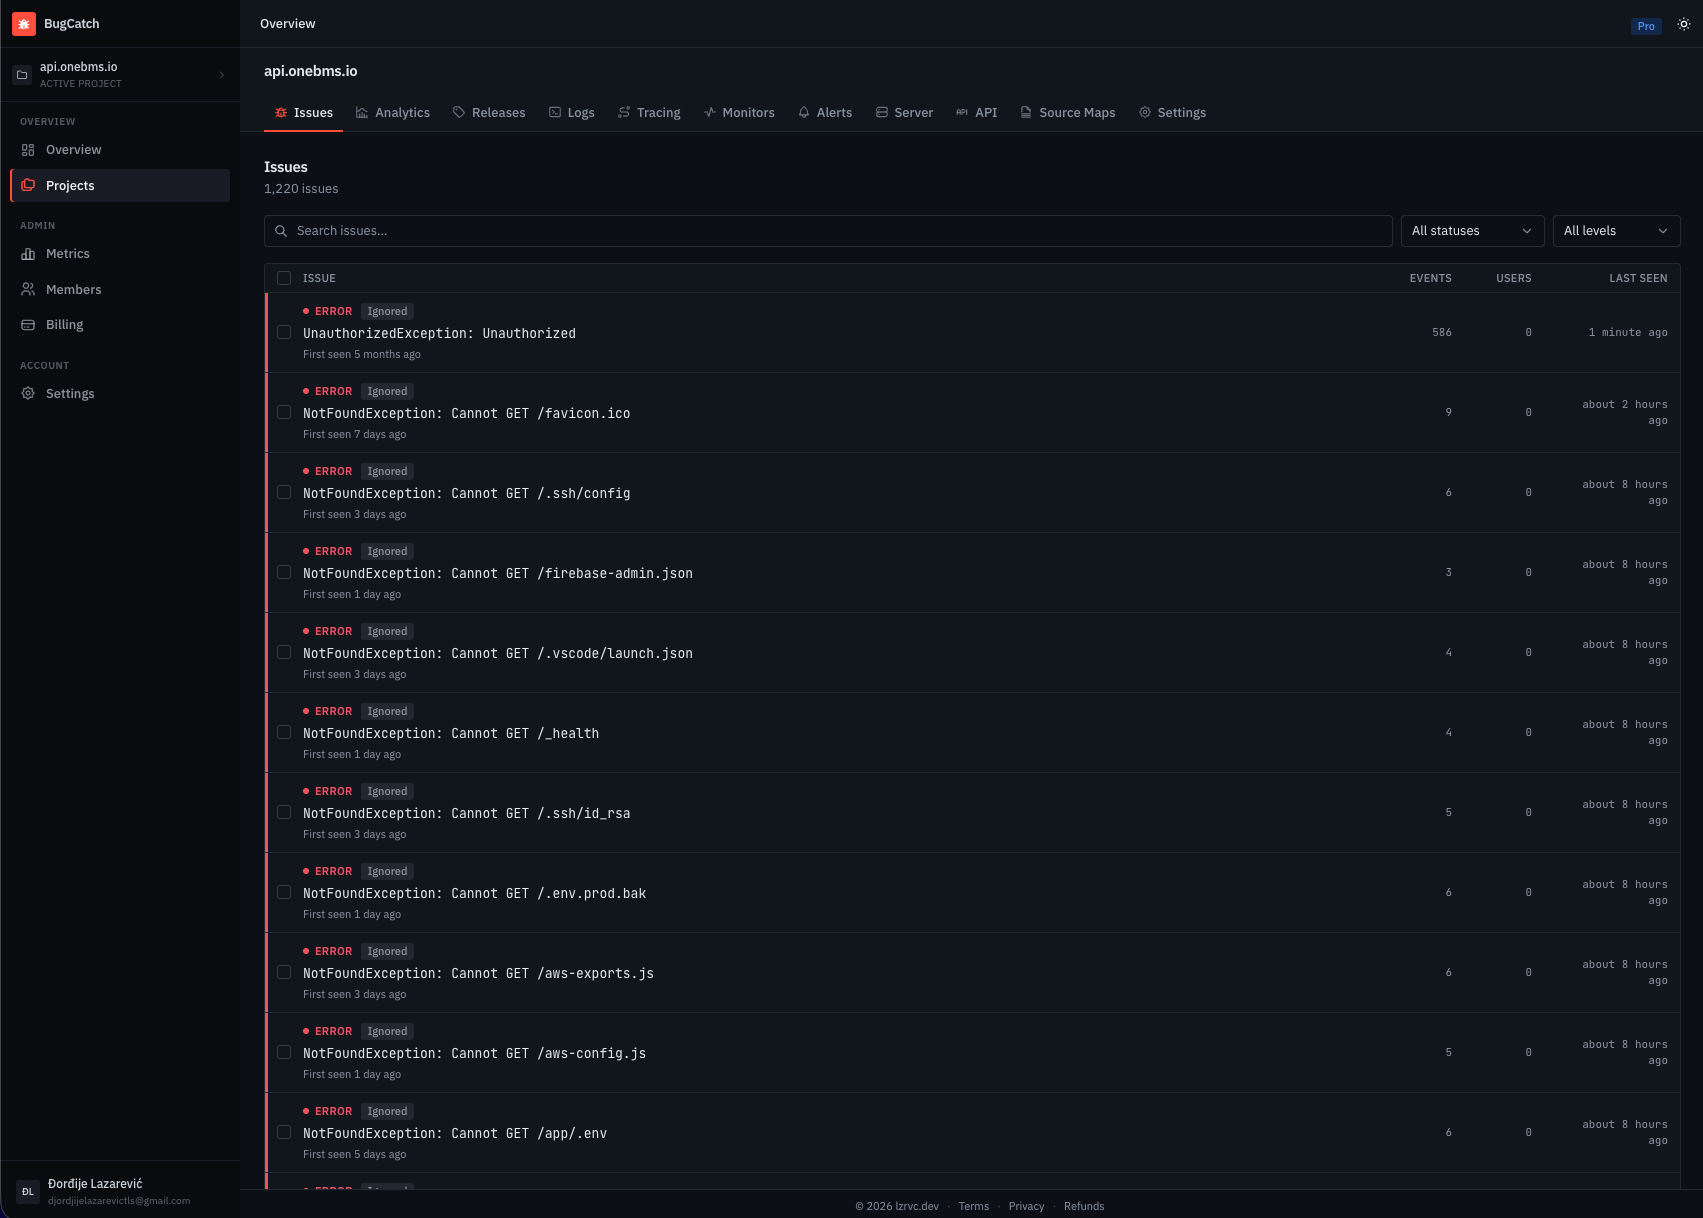
BugCatch issues list showing grouped errors and warnings with event counts, affected users, and last-seen times.
The issue list after fingerprinting. One row per distinct crash.

Event pipeline

What happens between the crash and your inbox

Four steps. Your app never waits for any of them.

  1. 01

    The SDK catches it

    Global handlers pick up uncaught errors and unhandled rejections. The SDK parses the stack, attaches the last 100 breadcrumbs - clicks, navigation, console warnings - plus the user, release, and environment you set.

  2. 02

    Ingest answers immediately

    The SDK key is checked against a Redis cache and the event goes onto a queue. Your app gets its response back right away - no blocking call, no latency added to the request that already failed.

  3. 03

    The worker fingerprints and groups

    A SHA-256 of the error type, message, and location becomes the fingerprint. A new fingerprint opens an issue. A known one increments its counters and adds the user to a set. Same crash, same row.

  4. 04

    You hear about it once

    New issues and regressions trigger an email or a webhook. Cooldowns hold the line at one notification per issue per four hours, so a crash loop stays a single message.

Capabilities

Grouped by where you actually meet them

In your code

What the SDK does once it's initialised.

  • Automatic capture

    Uncaught errors and unhandled promise rejections, with no per-call wiring. Add captureException and captureMessage where you want detail.

  • Breadcrumb trail

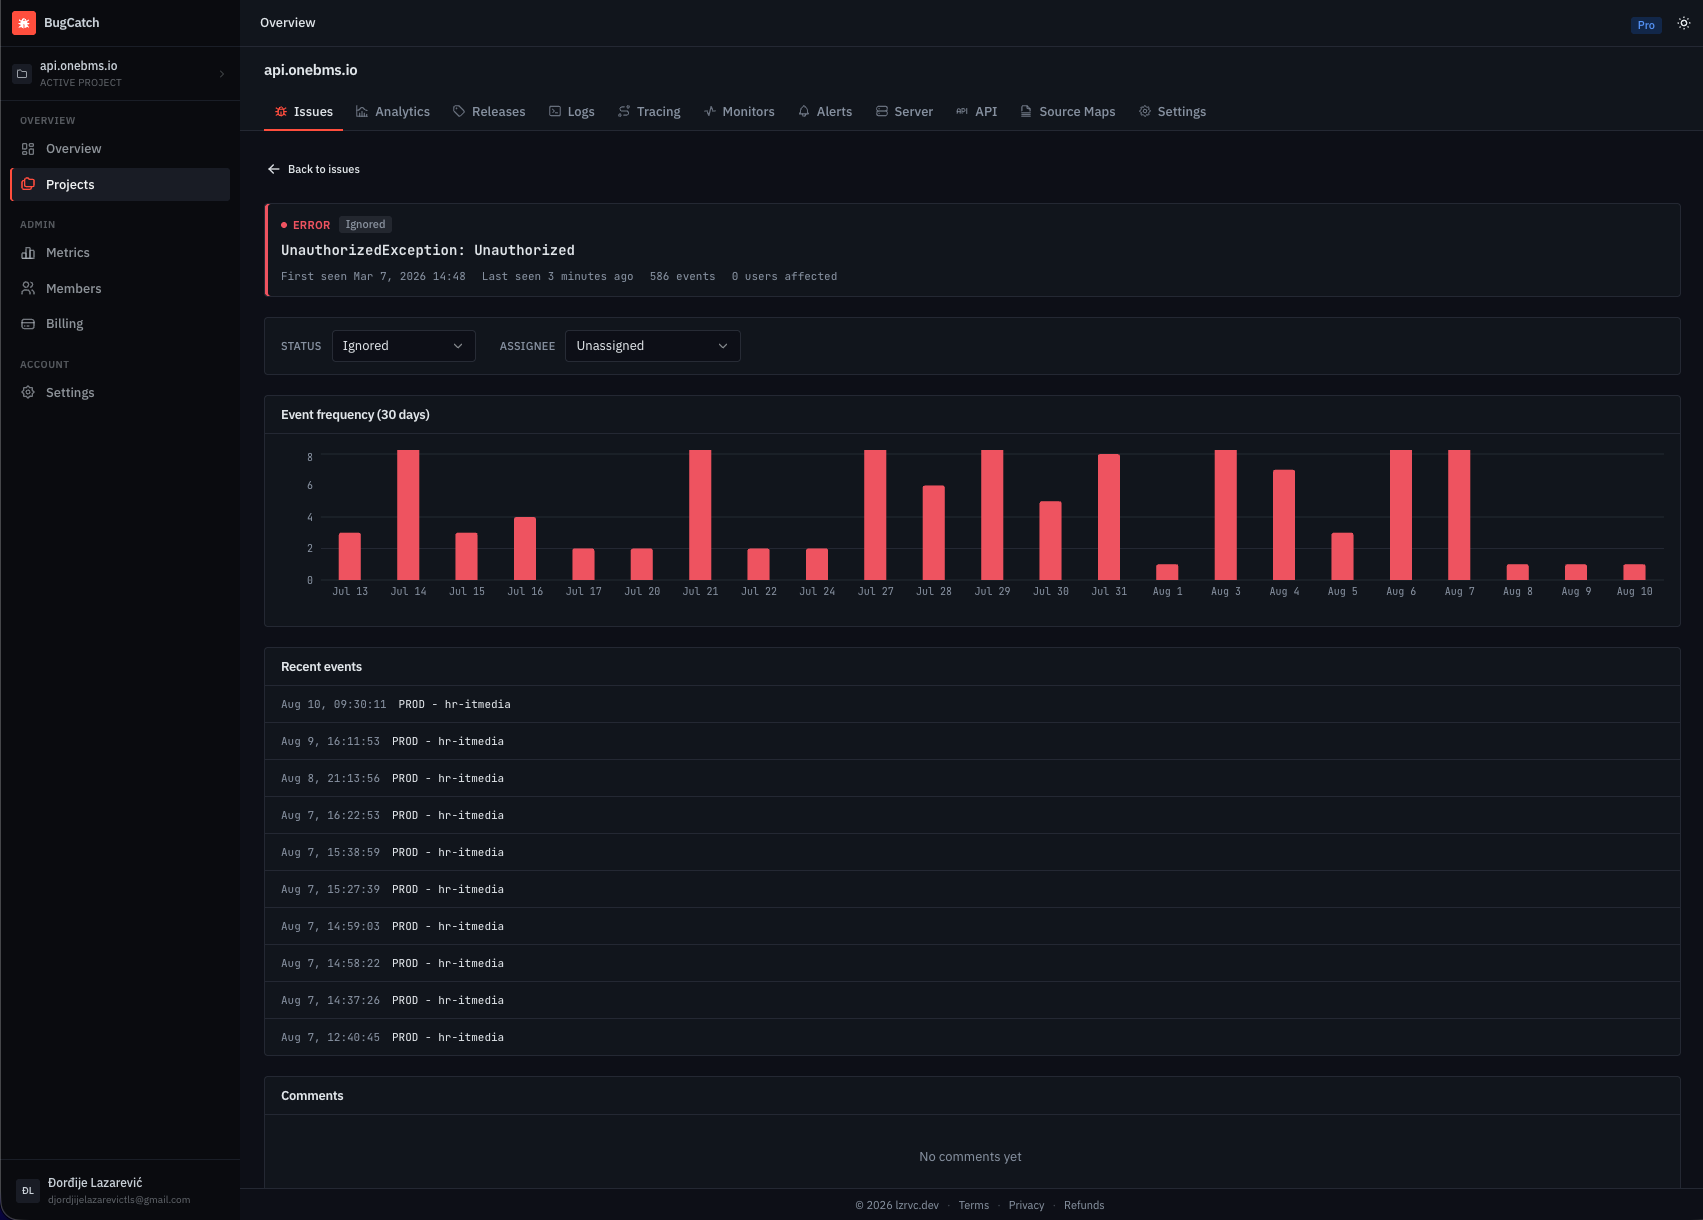
    Clicks, navigation, and console warnings from the 100 events before the crash, so you can reproduce it instead of guessing.

  • User context and tags

    Attach the signed-in user after login, tag by plan or region, and filter issues by any of it later.

  • beforeSend

    A hook that runs before anything leaves the process. Scrub fields, drop noisy error classes, or return false to discard the event.

On the dashboard

What you open when something looks wrong.

  • Readable stack traces

    Upload a source map per release and minified frames resolve to the original file, line, and column.

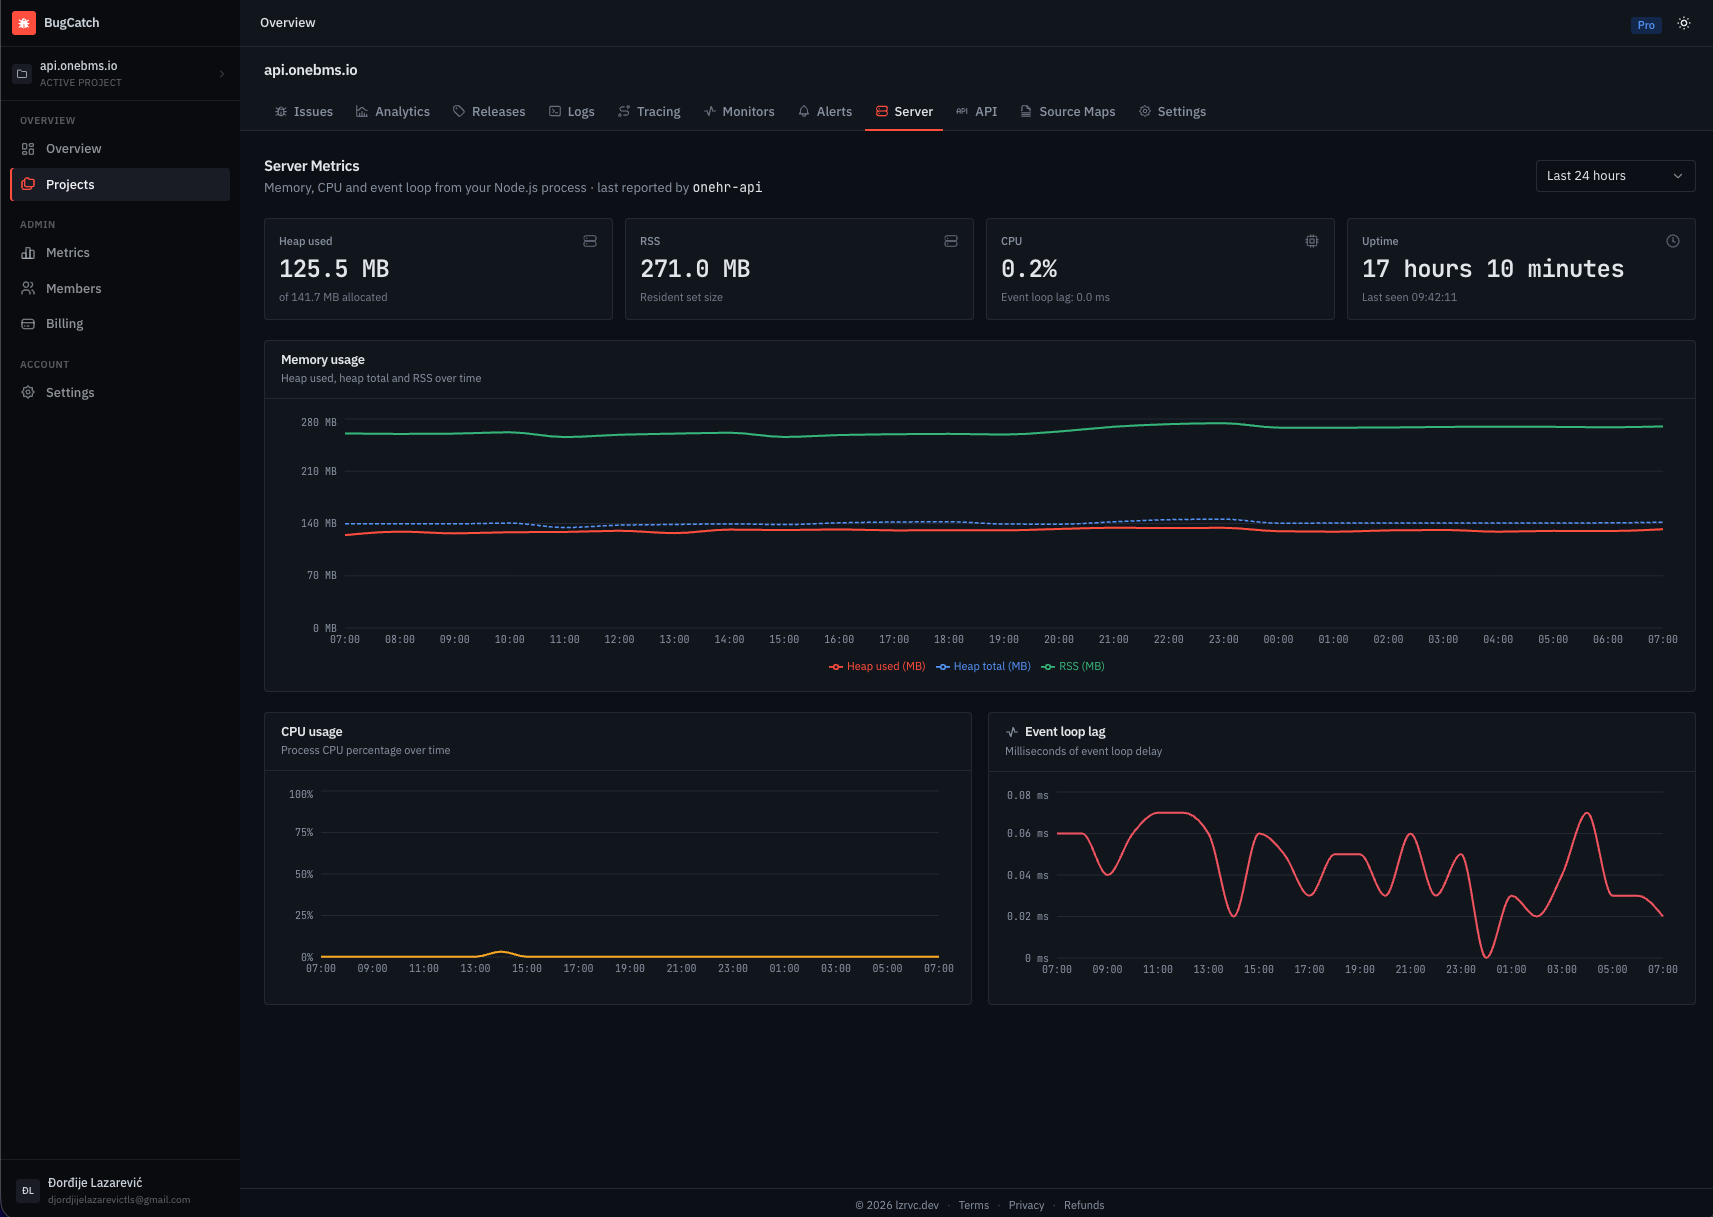
  • Server metrics

    Heap, CPU, and event loop lag reported per instance, so you can tell one struggling pod from a fleet-wide problem.

  • API and query timing

    Slow routes and slow database queries logged against their own thresholds, separate from your error stream.

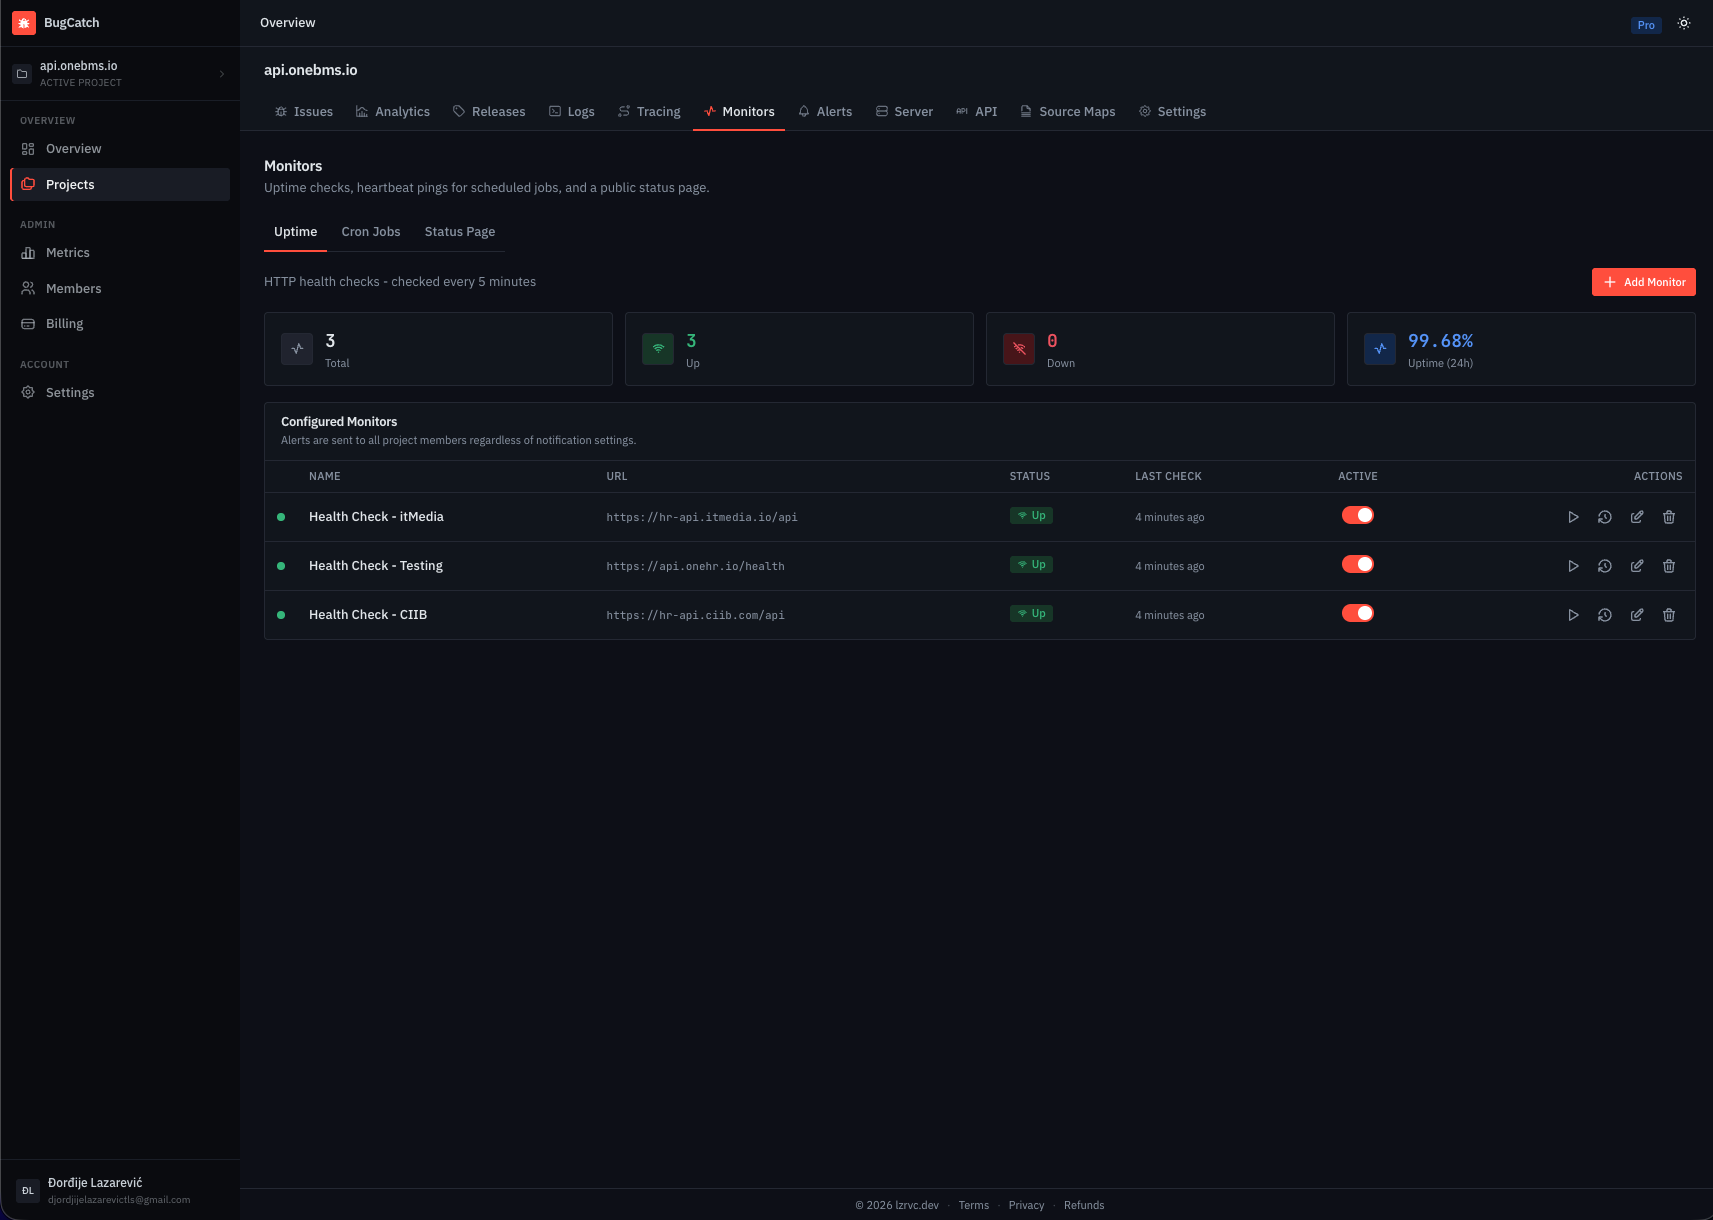
  • Uptime and cron monitors

    HTTP checks every five minutes for URLs, plus heartbeat pings for background jobs - three retries before a URL is called down, a missed ping before a job is.

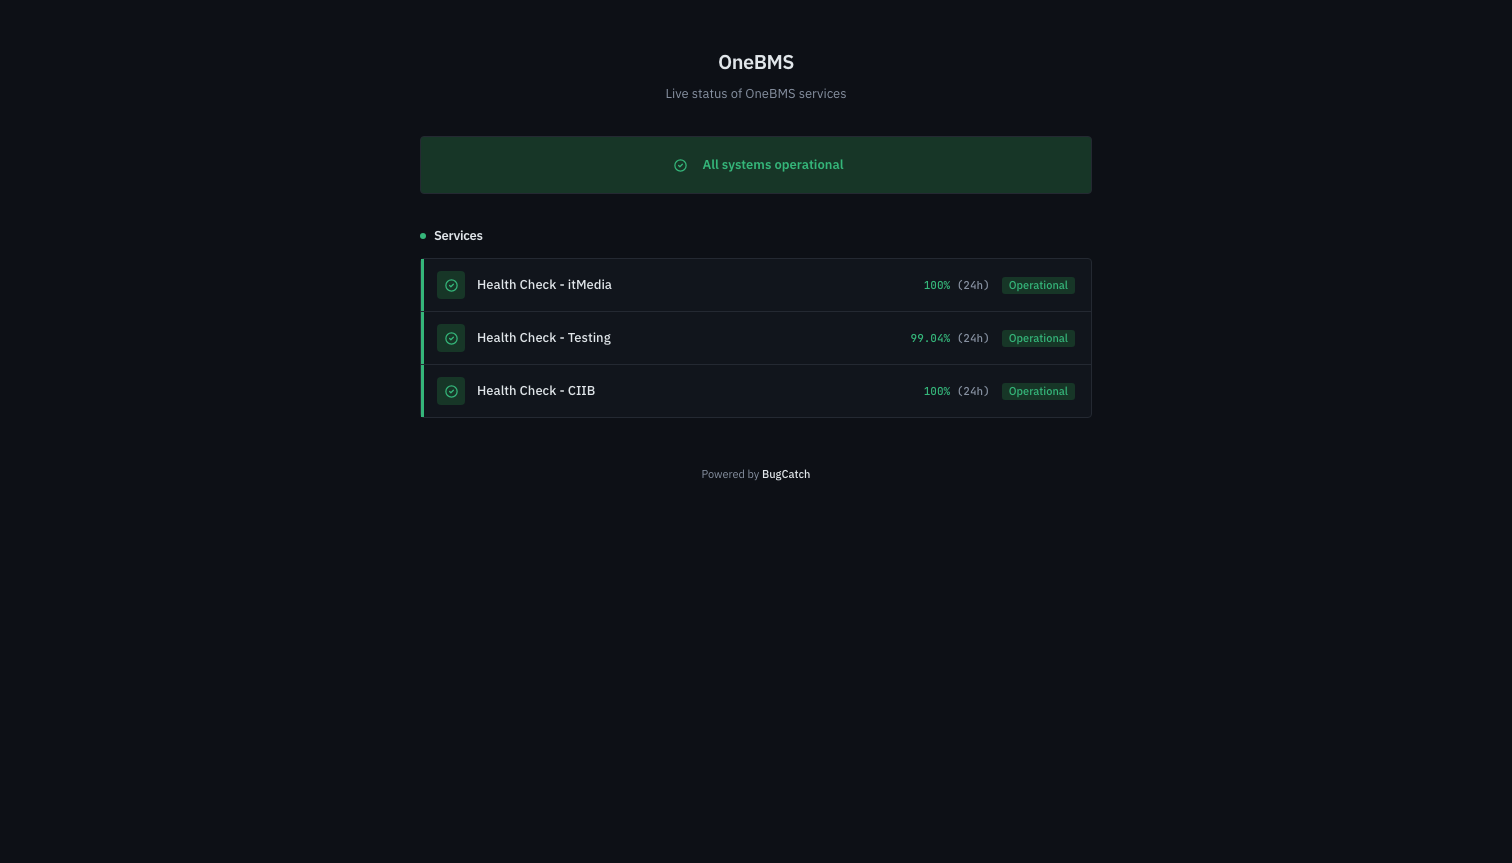
  • Public status pages

    A page at your own slug showing the monitors you choose and any incident you post, for the people who'd otherwise be asking you in a DM.

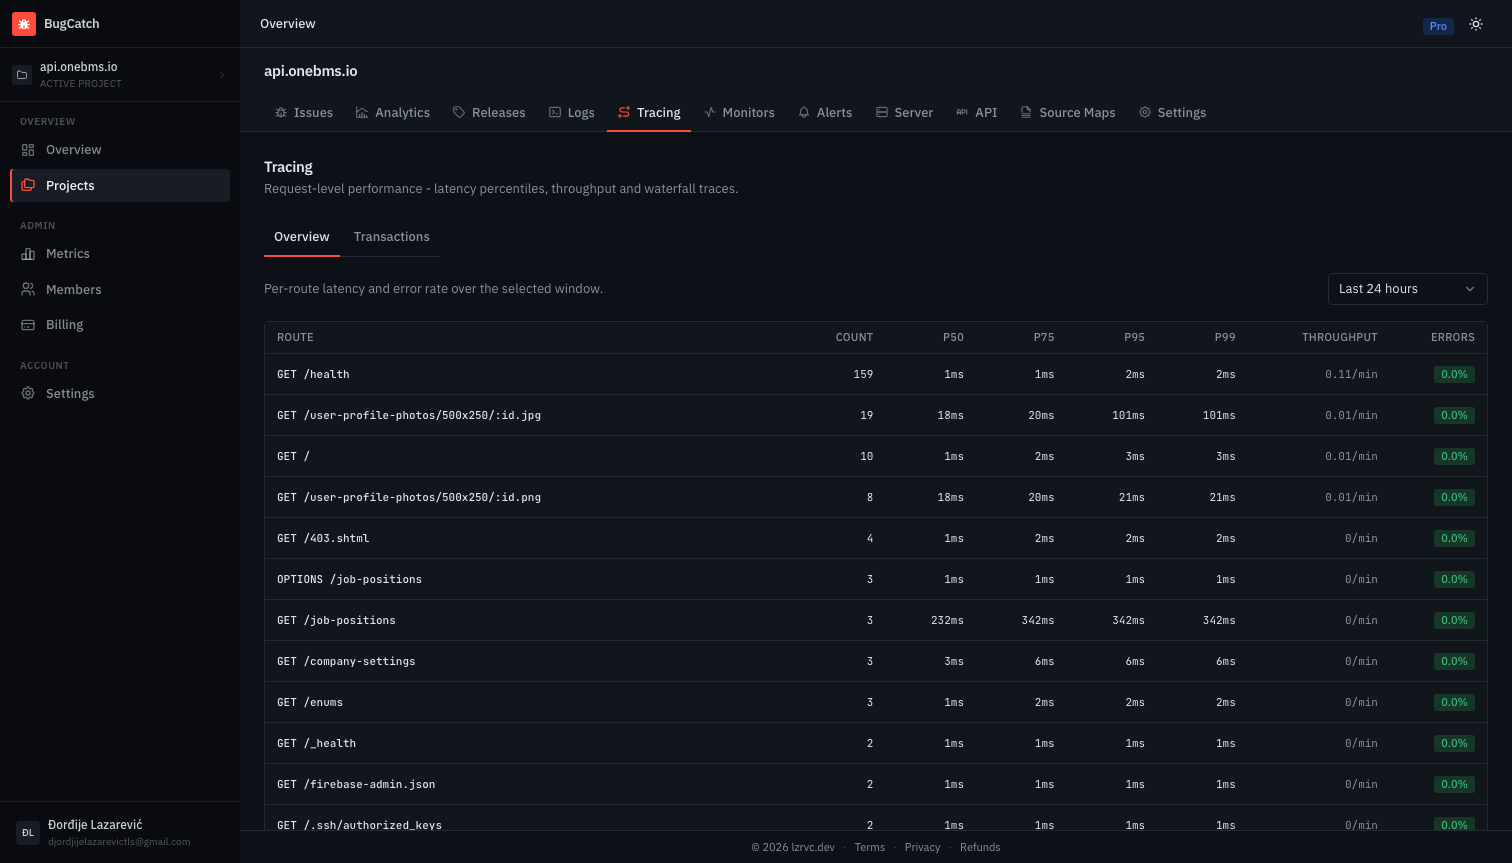
  • Distributed tracing

    See which request, and which part of it, was slow - not just that the server was under load. Pro and above.

  • Custom dashboards

    Arrange the charts you already have into a grid that opens the way you actually work. Pro and above.

  • Team and triage

    Invite members per project, comment on issues, merge duplicates the fingerprint missed, and bulk resolve or ignore once you've shipped the fix.

  • Retention you control

    Old events age out on a schedule you set, so the dashboard stays fast and storage stays bounded.

In your inbox

What reaches you when you're not looking.

  • New issues and regressions

    Email the first time a fingerprint appears, and again if something you resolved comes back.

  • Webhooks

    The same events posted to your endpoint, on the same four-hour cooldown, for Slack or anything else you route to.

  • Threshold alerts

    Memory, CPU, slow endpoints, and downed monitors, each on an independent cooldown so one bad afternoon doesn't become fifty emails.

  • Weekly reports

    A project digest every Friday at noon and an uptime summary every Monday at two, both to every member.

Integration

One init call and you're reporting

Create a project, copy its DSN from the dashboard, and pass it to init. Everything after that is automatic.

npm install bugcatch-sdk
src/main.tsx
import BugCatch from 'bugcatch-sdk';

BugCatch.init({
  dsn: import.meta.env.VITE_BUGCATCH_DSN,
  release: import.meta.env.VITE_APP_VERSION,
  environment: import.meta.env.MODE,
});

// Identify the user once they sign in.
BugCatch.setUser({ id: user.id, email: user.email });
BugCatch.setTag('plan', 'pro');

Alerting

Quiet by design

Most error tools fail at the second crash, not the first. BugCatch puts every notification behind a cooldown keyed to the issue, so a loop that fires ten thousand times still costs you one message.

Each alert class gets its own timer. A memory warning doesn't suppress a downed monitor, and a slow endpoint doesn't bury a new exception.

New issue or regression
Immediatethen one per 4 hours
Spike detected
Immediateone per issue per 24 hours
Webhook delivery
Immediate4-hour cooldown per event type
Memory, CPU
On threshold15-min cooldown each
Uptime & cron checks
Every 5 mindown after 3 retries, or a missed ping
Project digest
Friday 12:00to every member
Uptime report
Monday 14:00to every member

Pricing

Priced on events, not seats

Every plan includes the full issue pipeline - fingerprinting, stack traces, breadcrumbs and alerts. Paying moves the ceilings and unlocks the monitoring on top.

Free

For a single hobby project.

€0

forever

Start free
  • 1 project
  • 5,000 events / month
  • 7-day retention
  • 1 member
  • No monitors or source maps

Starter

For small teams shipping to production.

€4/mo

or €40 a year - two months free

Choose Starter
  • 3 projects
  • 50,000 events / month
  • 30-day retention
  • 3 members per project
  • 3 monitors - uptime or cron, plus a status page
  • 5 custom alert rules, 3 channels
  • Structured logs, source maps, spike detection

Business

For teams with volume, long retention and SSO needs.

€20/mo

or €200 a year - two months free

Choose Business
  • Unlimited projects and members
  • 2,500,000 events / month
  • 365-day retention
  • Unlimited monitors, alert rules and channels
  • SSO
  • Everything in Pro

Every paid plan starts with a 14-day Pro trial, no card required. Billing is handled by Paddle as merchant of record, so VAT and sales tax are included at checkout. Limits apply to the project owner - collaborators in a Pro project get Pro features on their own Free account. Full limits are in the plan reference.

Find out before your users tell you.

Create a project, copy the DSN, and ship the SDK in your next deploy.

npm install bugcatch-sdk